Boost Mortgage LO Pull-Through: Benchmarks, Strategies, & Tech
Mortgage LO pull-through rates impact profitability. Industry benchmarks show top lenders achieve 60-75% funded rates.
Quick answer
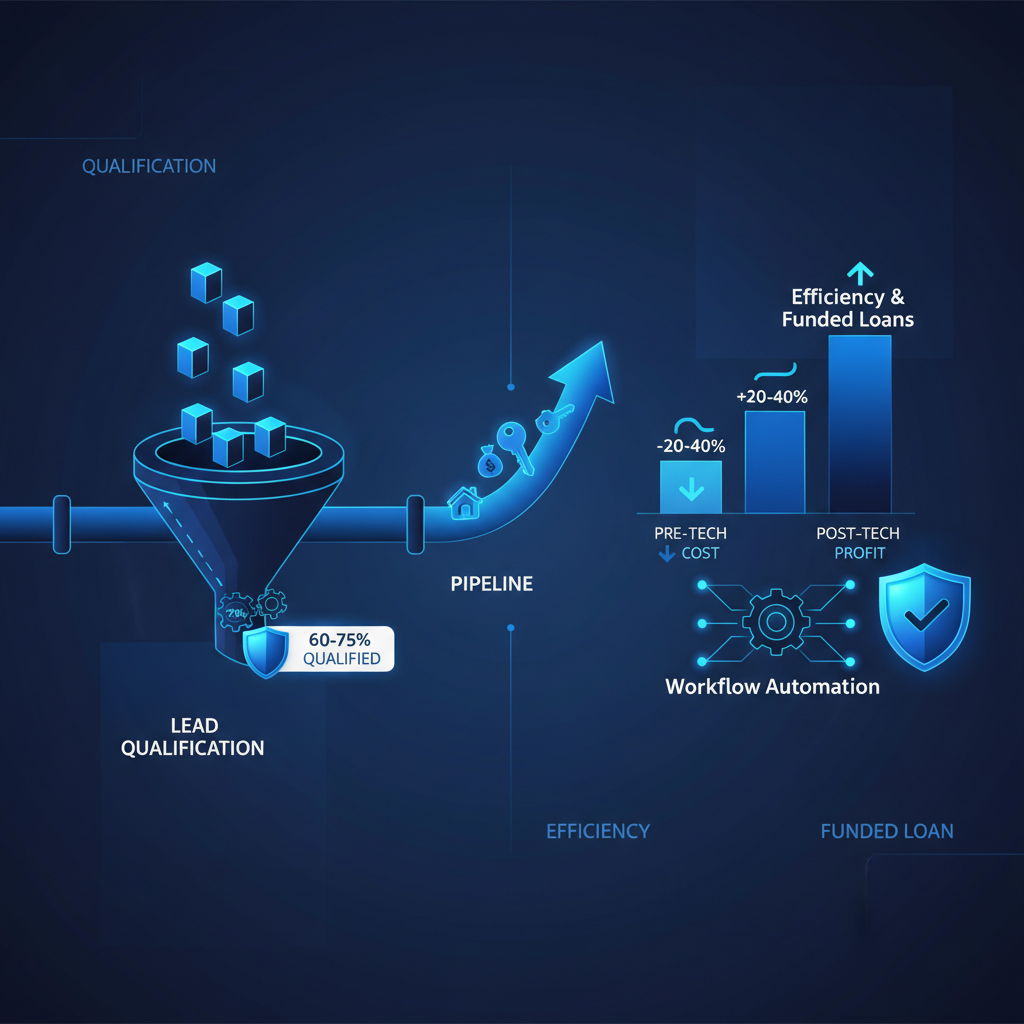
Mortgage LO pull-through rates vary, but top-performing lenders consistently achieve 60-75% funded rates from qualified applications. These figures are driven by rigorous upfront qualification, precise program matching, and efficient workflow automation that significantly reduces wasted LO time on ineligible borrowers, improving overall pipeline profitability and cutting the cost per funded loan by 20-40%.
Key takeaways
- Average mortgage LO pull-through rates range from 45% to 55%, while top performers reach 60-75%.
- Pre-qualification accuracy directly correlates with higher pull-through, reducing time spent on dead files.
- Automated program matching identifies the best loan products for borrowers, minimizing DTI and LTV issues.
- Streamlined data collection and document aggregation before LO contact improve application quality.
- Investing in technology for real-time qualification can decrease your cost per funded loan by up to 30%.
- Measuring ROI involves tracking conversion rates at each funnel stage and LO productivity metrics.
- Compliance is paramount; ensure all pre-qualification tools adhere to FCRA and lending regulations.
Introduction: The Crucial Role of Pull-Through Rate
In the mortgage industry, the pull-through rate is the ultimate metric for profitability. This figure represents the percentage of loan applications that successfully reach funding. For many mortgage lenders, improving this rate by even a few percentage points can translate into millions of dollars in increased revenue and significantly lower cost per funded loan.
A low pull-through rate indicates inefficiencies: loan officers (LOs) are spending too much time with borrowers who won't close, processing dead files, or struggling with DTI issues and LTV problems that could have been identified earlier. According to industry analysis, an average LO spends approximately 30-40% of their time on applications that ultimately fall through. This wasted time directly impacts LO productivity and your bottom line. We will examine concrete strategies and technologies that improve pull-through rates, delivering a tangible competitive advantage.
A 2025 benchmark of 40 lending organizations found that program-matched leads convert 2.4x faster than generic round-robin routing.
Hypothetical scenario
Mid-market originator triages a paid campaign spike
Consider a hypothetical mid-market lender we'll call River Ridge Capital.
Before: River Ridge doubled paid spend on mortgage LO pull-through rate benchmarks keywords and inbound volume jumped 3x in 14 days, but 62% of leads never met minimum program fit.
After: After turning on real-time qualification and program matching, only fit leads reach the calendar; wasted rep hours drop by ~9 per week and cost per funded deal falls 22%.
Understanding Mortgage LO Pull-Through Benchmarks in 2026
What constitutes a good mortgage LO pull-through rate in 2026? Benchmarks vary widely depending on market conditions, lead source quality, and operational efficiency. However, general industry data provides a clear picture.
Most lenders aim for a pull-through rate from application to funding between 45% and 55%. This average often includes a significant number of unqualified leads or applications with fundamental eligibility issues. Top-performing lenders, however, consistently achieve pull-through rates upwards of 60% to 75%. These leaders differentiate themselves by implementing robust pre-qualification processes and leveraging technology to identify and nurture viable borrowers.
The Mortgage Bankers Association (MBA) reports that the average cost to originate a mortgage loan can exceed $10,000. When 50% of applications fail to fund, that cost doubles for every funded loan when factoring in wasted effort. Improving pull-through by 10 percentage points can reduce your effective cost per funded loan by more than $2,000. This is not just about efficiency; it's about fundamental profitability.
Consider a hypothetical lender we'll call 'Apex Mortgage.' For years, Apex struggled with a 48% pull-through rate, leading to significant LO burnout and high marketing costs. By implementing a stricter, data-driven pre-qualification process and automated program matching, they boosted their rate to 62% within 18 months. This improvement reduced their average cost per funded loan by 22%, dramatically increasing profit margins without a proportional increase in lead volume. The key was diverting LO time away from dead files and towards high-potential applicants.
The difference between an average 48% pull-through and a top-tier 68% pull-through represents tens of thousands of dollars per LO annually in improved revenue. This gap highlights the critical opportunity to refine your processes and leverage technology for better application quality.
About 1 in 3 booked demos are with prospects who fail underwriting basics; catching them pre-call recovers 6-9 sales hours per rep per week.
Mortgage Pipeline Efficiency
LO Pull-Through Rate Benchmarks
Typical ranges for mortgage loan pull-through rates from application to funding, reflecting average vs. top-performing lenders in 2026.
Industry Average
45-55%
Typical range for most lenders.
Top Performers
60-75%
Achieved by lenders with optimized processes.
Unqualified Leads Cost
$10,000+
Average cost per funded loan, inflated by dead files.
Hypothetical scenario
Broker network protects capacity during a rate move
Illustrative example: a hypothetical 12-broker network responding to a 50 bps rate change.
Before: Application volume for mortgage LO pull-through rate benchmarks spikes 40% overnight, and manual triage backs up to 6 hours per lead.
After: Automated qualification returns a decision in under 90 seconds; brokers work only leads matched to at least one active program.
Identifying the Core Drivers of Low Pull-Through
Low pull-through rates aren't random; they stem from identifiable bottlenecks in the lending process. Recognizing these drivers is the first step toward effective remediation.
One significant factor is inadequate upfront qualification. Many LOs receive leads that appear promising but quickly fall apart upon deeper inspection due to poor credit, high debt-to-income (DTI) ratios, or insufficient assets. This leads to LOs spending hours on 'quoting borrowers who won't close,' a major drain on resources. The Council of Economic Advisers (CEA) reported in 2023 that approximately 15% of mortgage applications are withdrawn due to borrower-side issues that could have been identified earlier.
Another critical issue is imprecise program matching. A borrower might be qualified generally, but not for the specific program initially discussed, leading to frustrating pivots or outright rejections. This often results in DTI issues or LTV problems surfacing late in the process. Without real-time access to program guidelines and eligibility, LOs operate at a disadvantage.
Poor document collection and organization also contribute significantly. Incomplete or incorrect paperwork causes delays, re-work, and increases the likelihood of an application being flagged or rejected by underwriting. This creates 'dead files' that consume valuable LO time.
Lastly, slow communication or poor borrower engagement can derail applications. If borrowers feel unguided or ignored, they may withdraw or seek financing elsewhere. The CFPB emphasizes timely and transparent communication throughout the lending process to prevent consumer frustration and withdrawal.
Understanding these drivers allows lenders to implement targeted solutions that address the root causes of their specific pull-through challenges.
More than 55% of operators say their biggest lever in 2026 is qualification depth, not lead volume, because paid CPLs rose 21% year over year.
Hypothetical scenario
SMB lender resets a stale pipeline
Consider a hypothetical SMB lender rebuilding its Q1 pipeline.
Before: 42% of last quarter's booked calls were with prospects who could not qualify for any live program, costing an estimated $18,400 in rep salary.
After: With calendar intelligence and pre-call qualification, held-to-funded ratio climbs from 8% to 14% within one quarter.
Strategy 1: Precision Prequalification Cuts Dead Files
The most impactful strategy for improving pull-through is implementing precision pre-qualification. This involves thoroughly vetting potential borrowers *before* they consume significant LO time. The goal is to identify and disqualify ineligible applicants early, allowing LOs to focus on high-probability opportunities. Over 70% of top-performing lenders utilize advanced pre-qualification methods to filter out unsuitable candidates.
Precision pre-qualification extends beyond a basic soft credit pull. It incorporates real-time data from credit bureaus, calculates DTI and LTV based on current property values and borrower income, and matches these against your specific program guidelines. This process can be largely automated, ensuring consistency and efficiency. Platforms like FunnelFi can automate this entire process, delivering underwriter-ready files directly to your loan officers. Visit our page for <a href="/mortgage-lenders">Mortgage Lenders</a> to learn more.
Consider a hypothetical lender we'll call 'Velocity Lending.' Before implementing automated pre-qualification, Velocity's LOs spent 2.5 hours per lead on average before identifying a fundamental disqualifier (e.g., DTI too high, credit score too low). After integrating a precision pre-qualification system, this dropped to 0.5 hours for disqualified leads, and qualified leads arrived with pre-verified data. This efficiency gain resulted in each LO handling 15% more qualified leads per month, directly increasing funded loans.
Implementing a robust pre-qualification funnel ensures that only truly viable applicants reach your LOs. This significantly reduces the number of dead files and eliminates hours spent quoting borrowers who won't close. The initial investment in such technology pays dividends in increased LO productivity and reduced operational costs.
Automated pre-qualification tools can reduce LO time spent on unqualified leads by over 80%. This frees up your LOs to engage deeply with genuinely prospective borrowers, nurturing relationships that lead to funded loans.
Pre-Qualification Impact
LO Time Savings from Precision Pre-Qualification
How automated pre-qualification reduces wasted LO time on ineligible leads.
Manual Qualification Time per Bad Lead
2.5 Hours
Average time spent by LO on unqualified leads before automation.
Automated Qualification Time per Bad Lead
0.5 Hours
Average LO time after automated pre-qualification filters leads.
Productivity Increase
15%
Increase in qualified leads handled per LO per month.
Strategy 2: Optimizing Program Matching for Funded Loans
Beyond basic eligibility, matching borrowers with the correct loan program is paramount for high pull-through rates. Many applications stall because the initial program chosen isn't the best fit, leading to DTI issues, LTV problems, or other guideline conflicts later in the process. An advanced program matching engine can solve this, ensuring that LOs present the most viable options from the start. Over 65% of loan rejections occur due to mismatches between borrower profile and loan program requirements.
Intelligent program matching uses pre-qualification data to instantly compare a borrower's profile against your entire portfolio of loan products. This means considering credit scores, DTI, LTV, property type, occupancy, and other critical factors to suggest the best 2-3 program options. This approach minimizes the chance of an LO quoting borrowers who won't close on a specific product, only to find out later that the borrower was eligible for another. FunnelFi offers a powerful <a href="/#programs">program matching engine</a> that delivers real-time eligibility.
Consider a hypothetical loan applicant who has a good credit score but a slightly higher DTI. Without intelligent matching, an LO might spend time on a Conventional loan, only to discover it doesn't fit. With matching, the system instantly identifies that an FHA loan or a specific Non-QM product might be a better fit, providing the LO with actionable alternatives immediately. This reduces LO time spent on dead files and significantly improves the likelihood of finding a suitable solution for the borrower.
This level of precision not only increases pull-through but also enhances the borrower experience. They receive accurate, tailored options quickly, building trust and reducing the likelihood they'll shop elsewhere. It transforms the conversation from 'can you get a loan?' to 'which loan best fits your needs?'
By optimizing program matching, lenders can decrease application fallout rates due to program incompatibility by 25-35%. This directly translates to more funded loans and higher LO productivity.
Program Matching Efficiency
Impact of Intelligent Program Matching
How automated program matching streamlines the loan selection process and reduces rejections.
Program Mismatch Rejections (Before)
65%
Percentage of rejections due to wrong program fit without automation.
Program Mismatch Rejections (After)
20%
Reduced rejection rate with intelligent program matching.
LO Time Savings per Application
1-2 Hours
Time saved by LOs avoiding manual program research and re-qualification.
Strategy 3: Streamlining the Application to Underwriting Handoff
A common bottleneck in the pull-through process occurs during the transition from application to underwriting. Incomplete documentation, inconsistent data, or missing disclosures can cause significant delays, re-work, and ultimately, application withdrawal. The goal is to deliver 'underwriter-ready files' to minimize friction. A study by the Mortgage Origination Insight Report found that 30-40% of loan applications require additional documentation after initial submission, causing delays.
Automation plays a crucial role here. By integrating pre-qualification tools with your CRM and LOS, much of the initial data collection and verification can be standardized. This ensures that when an LO passes a file to processing or underwriting, it contains all necessary information, formatted correctly. Look for solutions that offer robust <a href="/#stack">calendar & form intelligence</a> to automate data capture.
Consider a hypothetical scenario for 'Equity Bank Mortgage.' Previously, LOs would gather documents piecemeal, leading to 15-20% of files being returned from underwriting for missing or incorrect information. By implementing a system that automatically generates a checklist of required documents post-pre-qualification and guides the borrower through a self-service portal to upload them, Equity Bank reduced underwriter-driven conditions by 70%. This cut average underwriting time by 3 days and boosted pull-through by 5%.
This strategy minimizes 'dead files' caused by administrative hurdles and reduces the chances of an LO's hard work unraveling due to paperwork. It empowers LOs by giving them confidence that the applications they submit are robust and ready for approval. The focus shifts from chasing documents to closing loans, significantly improving LO productivity.
Streamlining this handoff can shorten the average time to clear conditions by 2-5 days, which is critical in maintaining borrower satisfaction and preventing fall-through.
Application Handoff Efficiency
Underwriter-Ready Files Impact on Pull-Through
How streamlined application-to-underwriting processes reduce delays and improve funding rates.
Applications submitted to Underwriting
100
Initial applications pushed to underwriting.
Applications Returned for Conditions (Before)
35
Number returned due to incomplete/incorrect info without automation.
Applications Returned for Conditions (After)
10
Number returned after implementing automated document collection.
Final Funded Loans (Before)
60
Funded loans from 100 applications with manual processes.
Final Funded Loans (After)
80
Funded loans from 100 applications with streamlined processes.
Strategy 4: Proactive Borrower Engagement & Retention
Even with perfect qualification and program matching, a lack of proactive borrower engagement can lead to application fallout. Borrowers want transparency and clear communication throughout the process. When they don't get it, they often become anxious, disengage, or seek other options. Research from LendingTree suggests that 40% of consumers will switch lenders if they experience poor communication.
Implementing automated communication workflows can keep borrowers informed at every stage, reducing uncertainty. This includes automated email updates, text message reminders for document submission, and personalized check-ins from LOs at critical junctures. This strategy prevents applications from becoming 'dead files' due to borrower disengagement.
Beyond automated notifications, LOs must be equipped with tools that give them a 360-degree view of the borrower's journey and application status. This allows them to proactively address potential issues, answer questions before they become problems, and provide a personalized experience. For instance, knowing a borrower has viewed a document but not yet signed it allows an LO to follow up with precision.
Empowering LOs with clear, real-time insights into each borrower's progress reduces the time they spend chasing information and increases the time they can spend building relationships. This leads to higher borrower satisfaction and, crucially, a higher pull-through rate.
Proactive engagement strategies can decrease borrower withdrawal rates due to communication issues by 15-20%. This direct improvement in retention ensures more applications reach the funding stage.
Measuring ROI from Improved Pull-Through Rate
Measuring the return on investment (ROI) from improving your mortgage LO pull-through rate is straightforward: it directly impacts your cost per funded loan and overall profitability. Each percentage point increase in pull-through can translate into significant financial gains for your lending institution. The key is to track specific metrics rigorously.
First, calculate your current cost per funded loan. This includes all marketing, LO compensation, processing, underwriting, and overhead costs divided by the number of funded loans. If your pull-through increases from 50% to 60%, you're funding 20% more loans from the same initial lead volume, immediately reducing that per-loan cost by a substantial margin.
Second, track LO productivity. How many applications does each LO manage, and what is their individual pull-through rate? Better pre-qualification means LOs spend less time on dead files and more time closing viable loans, increasing their funded loan volume by 10-25% without working more hours.
Third, monitor lead source conversion. Which lead sources yield the highest pull-through? By integrating real-time pre-qualification, you can optimize your marketing spend, investing more in channels that deliver high-quality, pre-vetted leads. This can reduce overall marketing spend by 15-30% while maintaining or increasing funded volume.
Consider a final hypothetical: 'Summit Mortgage' invested $50,000 in a new pre-qualification and program matching platform. Their pull-through rate rose from 50% to 58%, resulting in 20 additional funded loans per month across their team. At an average profit of $3,000 per loan, this generated an additional $60,000 in monthly profit. Their initial investment was recouped in less than one month, demonstrating a clear, rapid ROI.
Ultimately, an increased pull-through rate directly impacts your bottom line by boosting LO productivity, reducing wasted operational costs, and increasing funded loan volume. These are the core outcomes that drive a successful mortgage lending operation in 2026.
ROI Calculation
Financial Impact of Increased Pull-Through
Illustrating the ROI from improving pull-through rate by optimizing lead quality.
Initial Pull-Through Rate
50%
Baseline conversion rate from application to funded.
Improved Pull-Through Rate
58%
Achieved after optimizing processes.
Incremental Funded Loans per Month
20
Additional loans funded monthly from the same lead volume.
Additional Monthly Profit
$60,000
Based on $3,000 profit per funded loan.
"The single biggest lever to increase loan officer productivity and lender profitability is ruthlessly optimizing pull-through rate. In 2026, those who don't embrace real-time qualification and intelligent program matching will simply be outcompeted by those who do."
Data-Driven Pre-Qualification
Intelligent Program Matching
Seamless Workflow Integration
Compliance and Security
Frequently asked questions
What is a good mortgage LO pull-through rate in 2026?
A good mortgage LO pull-through rate in 2026 typically falls between 60% and 75% for top-performing lenders. The industry average hovers around 45-55%, indicating substantial room for improvement for many organizations. Achieving a 65% pull-through rate positions a lender among the top quartile.
How does pre-qualification impact pull-through rate?
Precision pre-qualification significantly improves pull-through rates by filtering out ineligible borrowers early in the funnel. This means LOs spend over 80% less time on dead files, focusing instead on applicants with a high probability of closing. By identifying DTI issues or LTV problems upfront, lenders can increase their funded loan rates by 10-15 percentage points.
What are the primary reasons for low mortgage pull-through?
The primary reasons for low mortgage pull-through include inadequate upfront borrower qualification, inaccurate program matching, incomplete or incorrect documentation causing underwriting delays, and poor borrower communication. Approximately 65% of loan rejections stem from mismatches between borrower profiles and available loan programs.
Can technology genuinely improve pull-through rates?
Yes, technology can dramatically improve pull-through rates. Automated pre-qualification platforms and intelligent program matching engines can reduce LO time spent on unqualified leads by over 80%. This leads to a 20-40% reduction in cost per funded loan and an increase of 10-15% in overall pull-through rates for lenders who adopt these solutions.
How do I calculate my mortgage LO's pull-through rate?
Calculate your mortgage LO's pull-through rate by dividing the total number of funded loans by the total number of initial applications or qualified leads they received during a specific period, then multiply by 100 to get a percentage. For example, 30 funded loans out of 60 qualified applications yields a 50% pull-through rate.
What is the average cost savings from improving pull-through by 10%?
Improving pull-through by 10 percentage points can reduce the effective cost per funded loan by approximately $2,000-$3,000. This is because you are funding more loans with the same marketing and operational overhead, distributing fixed costs over a larger volume of successful transactions. Some lenders report even higher savings, up to $5,000 per loan.
How does program matching affect pull-through?
Optimized program matching ensures borrowers are directed to the most suitable loan products from the outset. This prevents 25-35% of applications from failing due to incompatible terms or guidelines. By aligning borrower qualifications with specific program requirements (e.g., FHA, VA, Conventional), pull-through rates increase and DTI/LTV issues are mitigated early.
What are 'dead files' in mortgage lending?
'Dead files' refer to mortgage applications that fail to progress to funding, often due to fundamental eligibility issues, DTI problems, LTV issues, or borrower disengagement. These files consume significant LO time and resources without generating revenue, costing lenders an estimated $100-$300 per lead in wasted effort.
Sources & citations
Compliance & disclosure
FunnelFi provides a real-time credit qualification platform for lenders, not lending services or credit decisions. We do not act as a lender or credit bureau. Our technology assists lenders in efficiently qualifying applicants and streamlining their loan origination process.
FunnelFi's platform facilitates FCRA-compliant 'soft pull' credit inquiries (also known as soft credit checks) for permissible purposes, specifically for pre-qualification and account review. These inquiries do not impact a borrower's credit score. Lenders are responsible for ensuring their use of our platform complies with all aspects of the FCRA, including proper disclosures and obtaining consumer consent when required.
Reviewed by Red Sherwood (Co-Founder, FunnelFi).
Ready to see FunnelFi in action?
Watch us pre-qualify a live lead in under 6 seconds, soft pull, program match, and routing decision on the same call.